


Social Media Analytics Dashboard: 5 Best Tools for Marketers
A social media analytics dashboard centralizes your metrics across platforms. Learn what to track, why it matters, and the five best tools to use in 2026.
Table of Contents
When social media came about, brands and creators often made decisions based on gut feeling and a screenshot of last week's best post. That doesn't fly anymore.
Today, social media teams are publishing across five or six platforms at once, each one spitting out its own metrics, its own definitions of engagement, and its own export format that rarely matches the others. Trying to piece together a clear picture from native apps alone is like assembling a puzzle where half the pieces come from a different box.
Enter: social media analytics dashboards. They create a single place where scattered platform data turns into actionable insights. If you're posting content but not centralizing your data, you're flying without instruments. Here's everything you need to know to fix that.
What Is a Social Media Analytics Dashboard?
A social media analytics dashboard is a data visualization tool that pulls key performance indicators (KPIs) and metrics from your social platforms and centralizes them in one visual, easy-to-read interface.
Instead of logging into six different native analytics tabs (Instagram Insights, TikTok Analytics, YouTube Studio, LinkedIn Analytics, and so on) and manually copying numbers into a spreadsheet, a dashboard automatically aggregates that data for you. It typically presents it through charts, graphs, and summary cards so you can see trends, compare platforms, and spot what's working without doing the math yourself.
Think of it as the difference between checking the weather by sticking your head out six different windows versus glancing at a single forecast that's already combined all the information for you.
Why Social Media Analytics Dashboards Matter
Social media isn't a side channel anymore. For a brand, it's often the front door; for a creator, it's the whole business. That means the pressure to prove what's working has gone up, and the time for guesswork is over.
Dashboards matter because they turn social media from a content-publishing exercise into a measurable part of how a brand or a creator operates. A good dashboard bridges the gap between analytics and real business outcomes.
Without centralized analytics, brands and creators are left reacting to vibes: a post "feels" like it did well, a partnership "seems" to be working. With a dashboard, that feeling gets replaced by a number and that number can be defended, whether it's in a budget meeting or a sponsorship negotiation.
On top of that, there's speed. Trends move fast on social media, and what's relevant on a Monday can be stale by Thursday. Dashboards that update in real time let marketers catch a spike or a dip while there's still time to act on it.
What You Can Track in a Social Media Dashboard
Most dashboards are built around a handful of core data categories, even if the exact layout differs by tool. Here's what you'll typically find:
- Audience growth: follower or subscriber counts across platforms and how they're trending over time
- Engagement metrics: likes, comments, shares, saves, and engagement rate, which is usually a far more telling number than raw likes alone
Want to put this into practice?
SideShift connects you with vetted UGC creators who actually deliver. Start your free trial and post your first job in under 10 minutes.
- Reach and impressions: how many people saw your content and how many times it was shown
- Content performance: which specific posts, videos, or stories performed best (and worst), broken down by format and platform
- Click-through and conversion data: how many people clicked a link in your bio or post, and what they did once they landed on your site or storefront
- Audience demographics: age, location, gender, and sometimes interests, helping you confirm whether you're reaching the people you think you are
- Sentiment and brand mentions: tracking how people are talking about your brand or you as a creator, not just whether they're engaging with your posts
- Competitor benchmarking: some dashboards let you track competitor brands or fellow creators so you can compare your growth and engagement against theirs
- Paid vs. organic performance: separating out what's working because of ad spend or boosted posts versus what's earning attention on its own
Put together, these data points answer the questions brands and creators actually need answered: What's working? Who's seeing it? And is it driving meaningful outcomes like engagement, followers, or sales?
Top 5 Social Media Analytics Dashboards
Choosing a tool is mostly about strategy and what meets your business needs. The right alternative depends on whether you're managing an in-house brand presence, running an agency with multiple clients, or coordinating a network of creators. Match the tool to your workflow, not the other way around.
Here are five of the best options on the market right now:
1. SideShift: full influencer campaign management infrastructure, from analytics to contracts and payment, for brands and agencies that run UGC campaigns at scale
2. Sprout Social: powerful data source that connects multiple teams and provides customizable features for in-depth, presentation-ready reports
3. Hootsuite Analytics: heavily AI-powered platform that consolidates analytics, publishing, and customer support in one place
4. Buffer: simple and minimalistic dashboard that offers a straightforward data visualization for an affordable price
5. Social Status: built exclusively for analytics and reporting for accounts, ads, and influencer campaigns, with a flexible pricing scale
Take a closer look at each of these dashboards, what they do, and for what kind of business they're built for.
1. SideShift
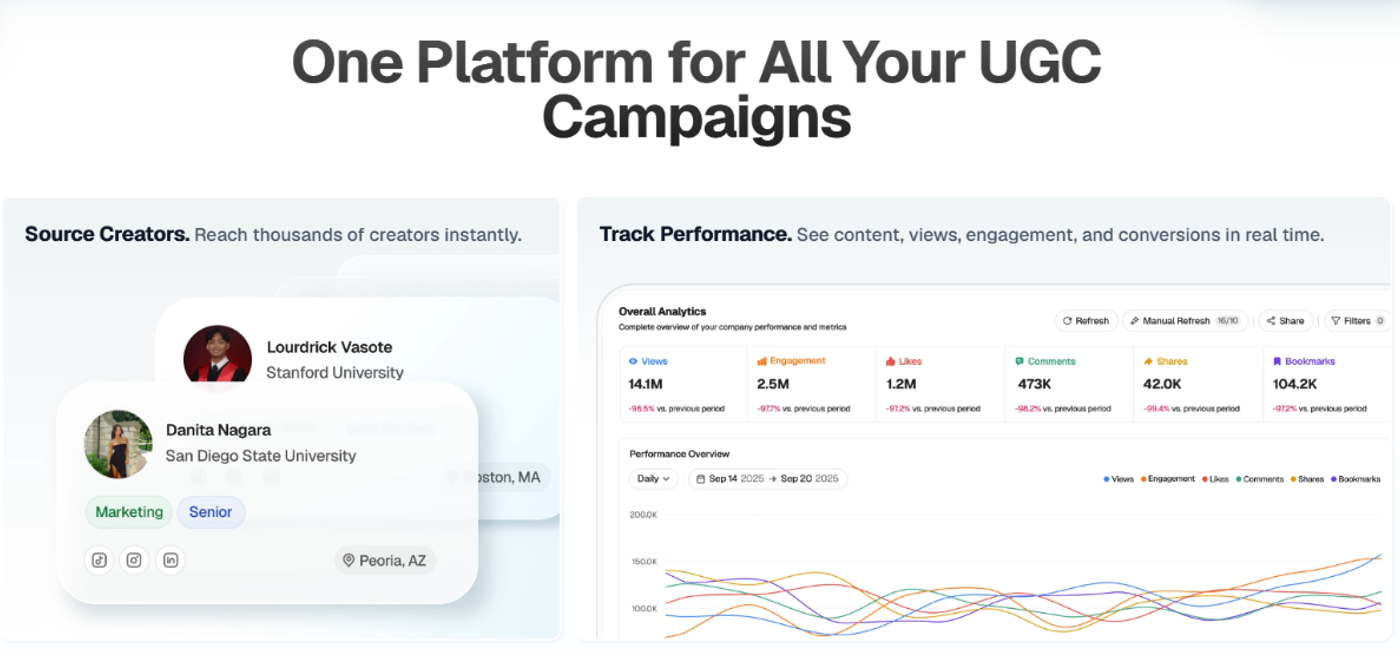
Best for: Brands and agencies running influencer marketing and UGC campaigns at scale.
If you're in the influencer marketing industry, running UGC campaigns, managing a roster of creators, and need to clearly see the results of this type of strategy, SideShift is built specifically for that workflow.
It includes a real-time performance dashboard that tracks content, views, engagement, and conversions across every creator and campaign in one place, replacing the spreadsheets that still plague a lot of creator marketing. In other words, SideShift brings influencer marketing into one workflow, making it easier to scale creator partnerships without losing sight of key metrics.
SideShift is also a creator sourcing platform. It connects brands with pre-vetted, high-quality UGC creators of all niches, from fashion to tech. Brands can also automate payments within the platform, reducing manual work and allowing teams to focus on more strategic demands.
Want to put this into practice?
SideShift connects you with vetted UGC creators who actually deliver. Start your free trial and post your first job in under 10 minutes.
Pricing is flexible:
- Starter Plan ($299/month): allows up to four hires with a typical output of 250+ videos a month.
- Growth Plan ($499/month): allows up to 15 hires with a typical output of 500+ videos a month.
- Scale Plan ($999/month): you can hire unlimited creators and expect an output of 1000+ videos a month.
For agencies there are two options: the $999 One Flat Rate that covers your entire agency and clients and the $150 Per-Client Billing, where you or your client pays per account.
2. Sprout Social
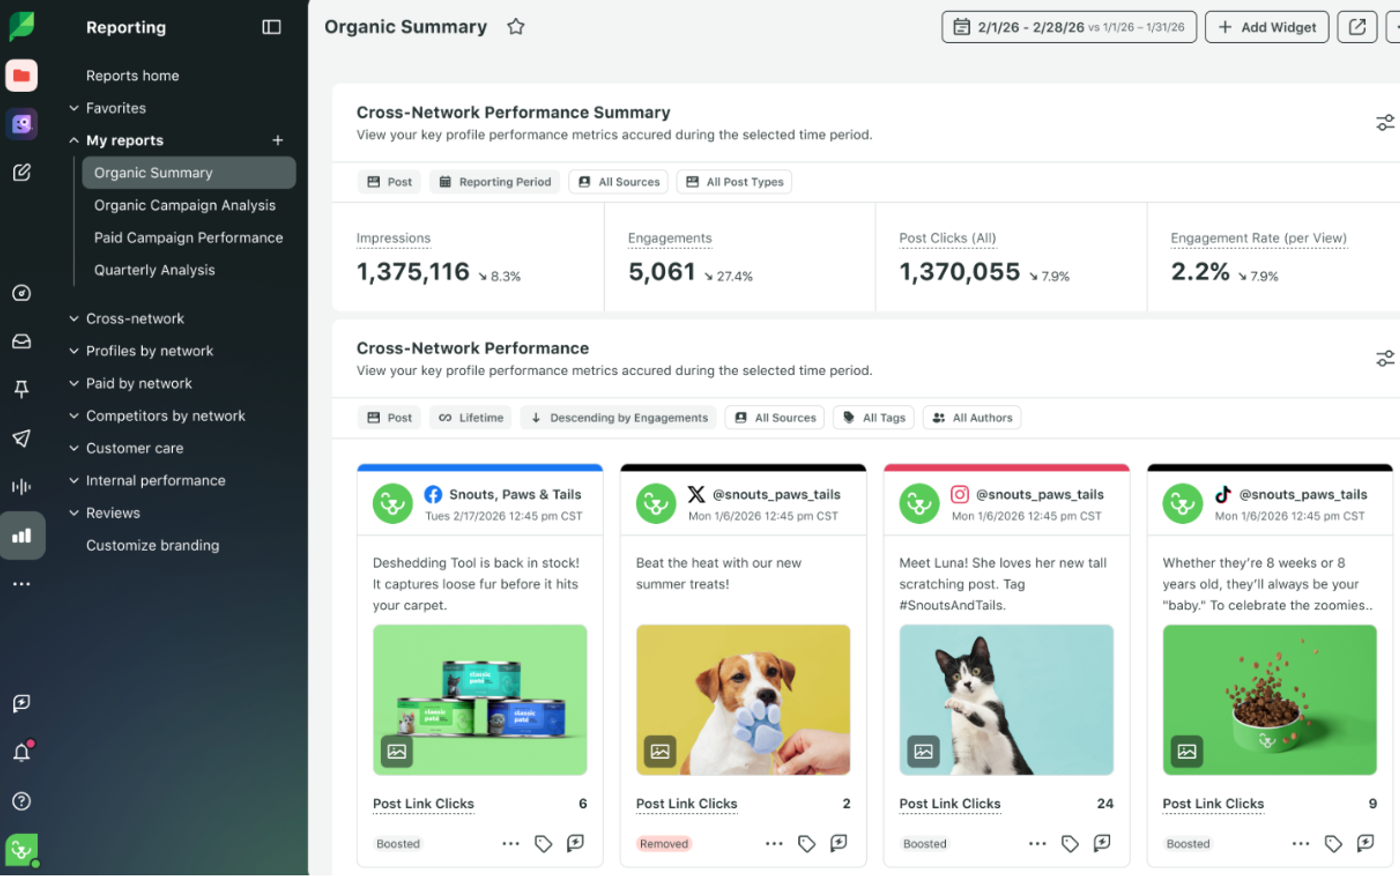
Best for: Mid-size to large marketing teams that need polished, boardroom-ready reporting alongside deep cross-team collaboration.
One of the most established names in the category, Sprout Social is built for teams that need presentation-ready reporting tied directly into a broader social management workflow. Its unified analytics dashboard lets you view individual networks or compare them side by side, so you're not switching between separate platform tabs to see the full picture.
Sprout is also big on customization. It lets teams drag and drop widgets to build reports around engagement, audience growth, or impressions, rather than relying on a default template. A tagging feature also lets teams label content by campaign, theme, or objective, then pull a dedicated performance report for just that tag.
The downside is Sprout's extensive and complex reports, which can be challenging for beginners to navigate. Sprout plans start at $199/month for the Standard Plan that supports five social media accounts. For an unlimited number of social media accounts, there's the Professional Plan for $299 and the Advanced Plan for $399.
3. Hootsuite Analytics
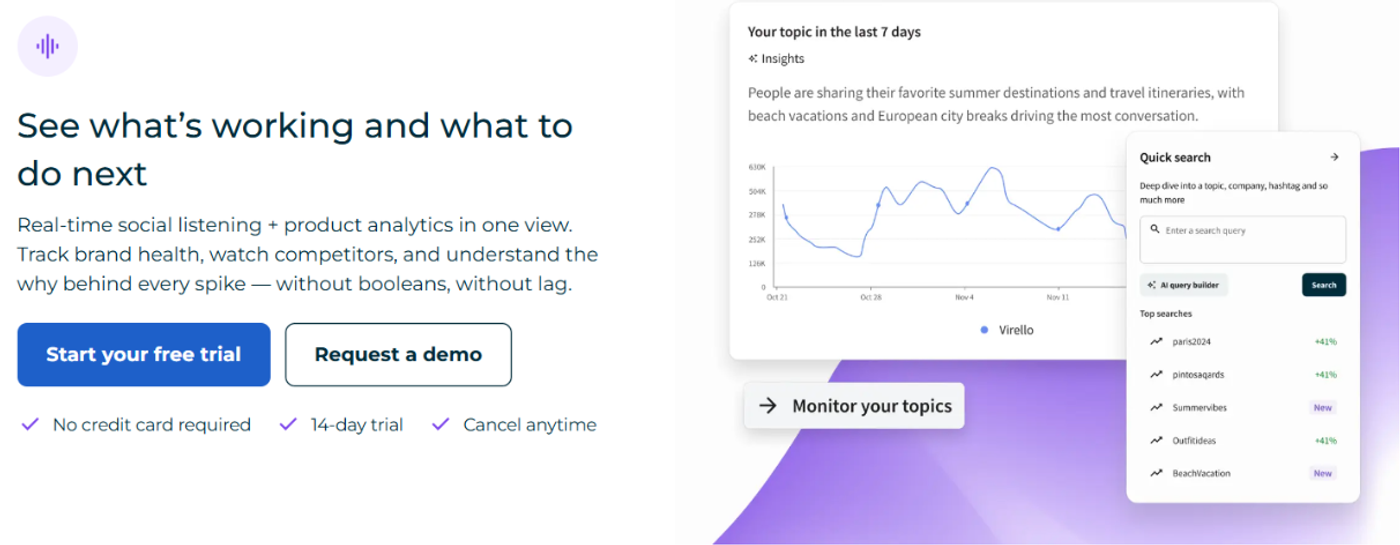
Best for: Teams that want scheduling, publishing, and reporting to live in the same platform, especially at an enterprise scale.
A long-running player in social management, Hootsuite pairs publishing with cross-platform reporting that's increasingly leaning on AI. Post-level metrics can be tracked for up to a year after publishing, which is useful for catching content that goes viral well after it was posted, and reports can be filtered by team, network, or campaign for faster reviews.
Hootsuite has also been layering in AI-driven insight tools: trend detection that flags spikes in mentions, keywords, and sentiment across platforms and automated anomaly detection that surfaces unusual performance swings before they become a bigger problem. On the downside, Hootsuite's interface can be a little bit more cluttered than competitors with less add-ons.
Pricing starts at $99/month for the Standard Plan that supports up to 10 social media accounts. With the Professional Plan ($199) and the Advanced Plan ($399), you can manage unlimited accounts. The Advanced Plan allows you to streamline approvals and co-work across teams, measure team performance and efficiency, and coordinate content and customer care, functionalities that the Professional Plan doesn't offer.
4. Buffer
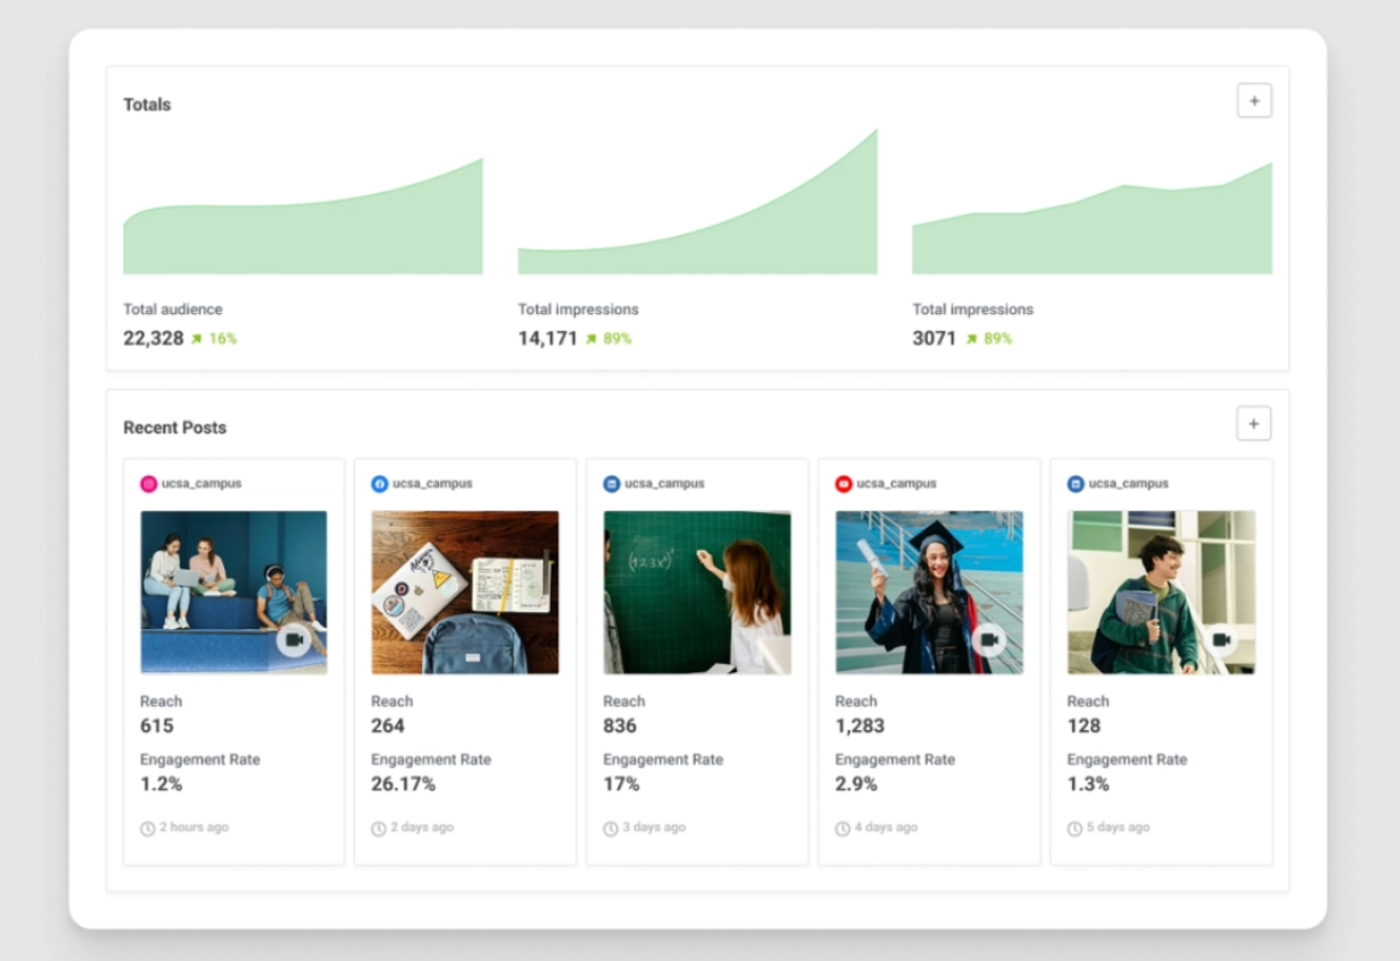
Best for: Solo marketers, creators, and small teams that want clear analytics without a steep learning curve.
Buffer keeps its analytics dashboard simple and useful. It surfaces your best-performing post types, optimal posting times, and content formats without burying you in menus, and its Best Time to Post recommendations get sharper the more consistently you publish through the platform.
Want to put this into practice?
SideShift connects you with vetted UGC creators who actually deliver. Start your free trial and post your first job in under 10 minutes.
It's not built for deep competitive benchmarking, enterprise-scale reporting, or teams that need to prove return on investment (ROI) to leadership, which makes it a bit simpler than others. But for teams that want clarity without complexity, and don't want to pay for features they'll never touch, Buffer is one of the easiest tools in the category to actually stick with.
Buffer has a Free Plan where you can connect up to three channels and schedule 10 posts per channel and get basic analytics. The Paid plans are the Essentials Plan for $5/channel and the Team Plan for $10/channel. They offer an extended analytics history and unlimited scheduled posts and add CSV exports, so you can build custom reports elsewhere if needed.
5. Social Status
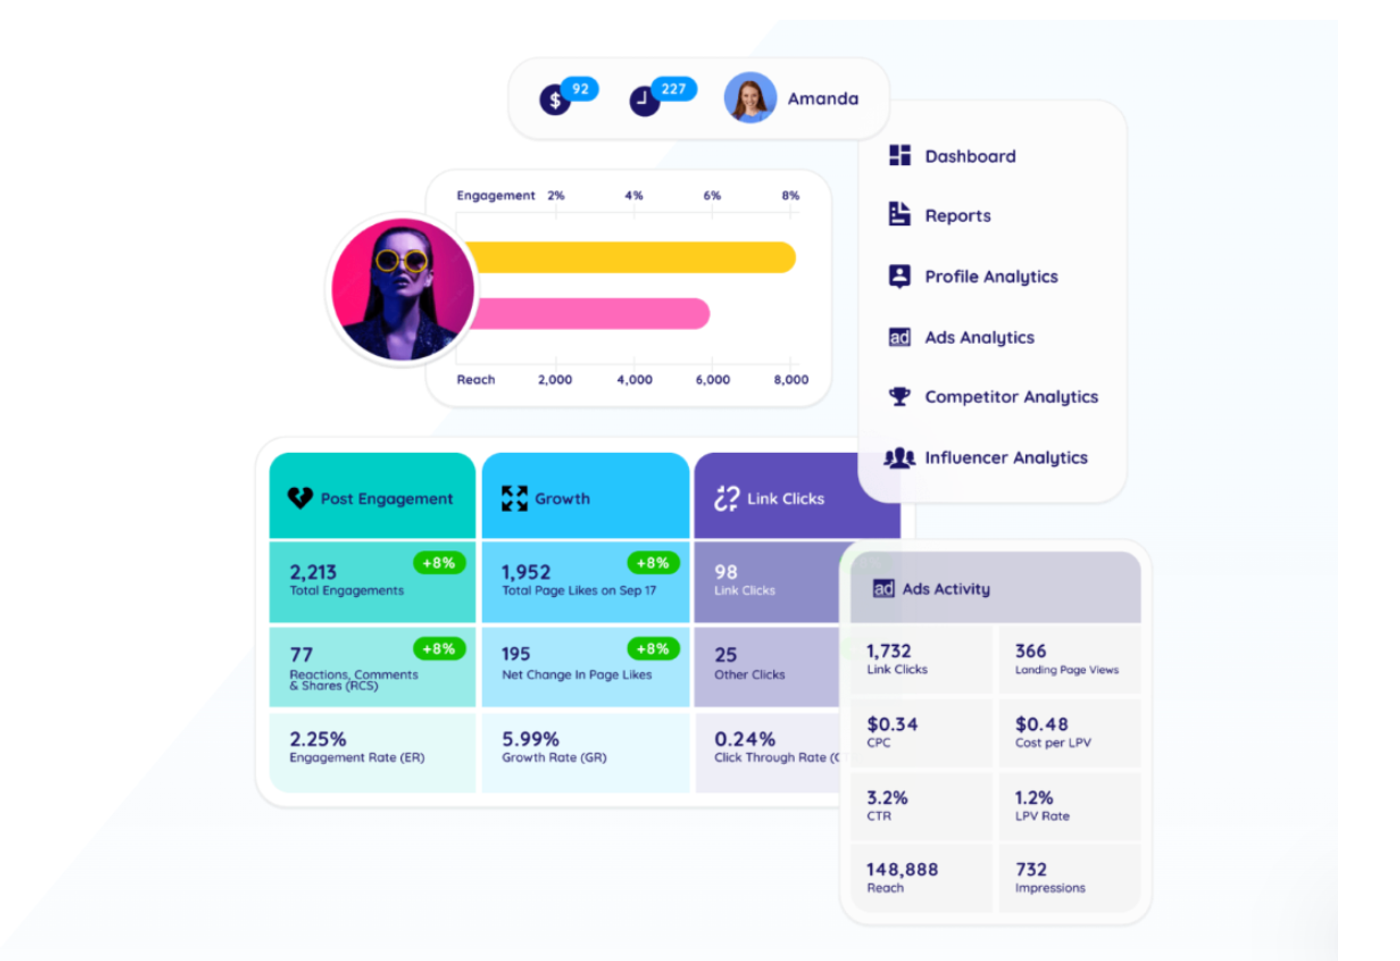
Best for: Agencies and teams that already have a publishing tool but want sharper, more flexible reporting layered on top.
A dedicated analytics and reporting tool rather than a full management suite, Social Status is built for teams and agencies that want depth. Its dashboard is split into four distinct views: Profile Analytics for your own accounts, Ads Analytics for Meta ad spend, Competitor Analytics for benchmarking any public profile against your own, and Influencer Analytics for tracking creator and campaign performance.
The competitor benchmarking is a particular strength: you can add any public profile on Facebook, Instagram, TikTok, YouTube, or X and see how your posting frequency, engagement rate, and follower growth stack up against theirs. The catch is that Social Status is analytics and reporting only, there's no publishing or scheduling, which makes it a poor fit for marketers looking for an all-in-one platform.
Social Status plans are very flexible and priced by a Plan Quota, which corresponds to every single social media profile, ad account, competitor or influencer profile you connect or add to your dashboard.
The Bronze Plan costs $99/month for 100 Plan Quota, the Silver Plan costs $199/month for 200 Plan Quota, and the Gold Plan costs $399/month for 500 Plan Quota. There's also the Platinum Plan for $799/month that includes 1,000 Plan Quota and the Enterprise Plan for $1,499/month that includes unlimited Plan Quota.
How to Make Your Social Media Dashboard Better
A dashboard isn't a "set it and forget it" asset. It should evolve as performance changes and new goals are set. Here are a few ways to sharpen yours:
- Cut the vanity metrics. Follower count feels good to look at, but if it's not tied to a real goal, it's taking up space that a more useful metric could occupy. If follower count is currently the biggest widget on your dashboard, try replacing it with a weekly engagement rate trend line. If no one misses it, that's a good indication it wasn't providing much value.
- Customize by audience. The dashboard a brand's leadership wants to see isn't the one the content team needs, so build different views for different audiences. In practice, this might mean a one-page "Executive View" with total reach, engagement, and conversions, and a separate "Content View" that breaks performance down by post format, posting time, and platform for the people actually creating the content.
Want to put this into practice?
SideShift connects you with vetted UGC creators who actually deliver. Start your free trial and post your first job in under 10 minutes.
- Automate what you can. Manual data entry introduces errors and eats time. Lean on integrations and APIs wherever possible. If you're still exporting CSVs from four different native apps every Monday morning, that's a sign to invest in a tool with direct platform integrations, since the hours saved usually pay for the subscription.
- Add context. A spike or dip means more when it's paired with a note about what campaign, event, or algorithm change that might have caused it, and most dashboard tools support comments directly on a chart. A one-line note like "Boosted this post for the product launch" saves whoever reads the report next from having to guess or ask.
- Test your visualizations. If you or your team consistently misread a chart or ignore a section, redesign it. A quick way to test this: show a chart to a teammate for five seconds, then ask them what it means. If they can't answer, the chart needs to be simplified, relabeled, or cut entirely.
- Loop in AI where it helps. Many modern dashboard tools now offer AI-powered insights that flag anomalies or surface trends a human might miss while scrolling through rows of numbers. Use it to catch things like an unusual engagement spike overnight or a sudden dip in reach, then have a person decide what, if anything, to do about it.
Marketers who treat their dashboard as a living tool that is reviewed, refined, and questioned regularly, get far more value out of it than those who build it once and let it run on autopilot.
Track Your UGC Campaigns with SideShift
Spreadsheets and screenshots of individual built-in social media analytics boards can only get you so far when you're managing dozens of creators across multiple campaigns.
SideShift gives you one real-time dashboard for every piece of creator content, every campaign, and every dollar spent, so you always know what's working and who's driving results. When you're ready to scale, SideShift gives you an end-to-end campaign management workflow. You can source in a poll of 800,000+ pre-vetted creators, handle contracts, and process payments, all inside the same platform.
Join SideShift for free today.
FAQs
1. Is there any all in one social media analytics tool?
Yes, for example, Hootsuite and Sprout Social for social media management and performance analysis. For UGC campaign management and performance analytics, there's SideShift, which also connects brands and creators, allows you to close contracts and schedule payments all in one tool.
2. Why use social media analytics tools?
Social media analytics tools are important because they pull data from all your social media platforms and combine it into a single dashboard. They reduce time spent analyzing and creating individual reports for each platform, allowing your team to act faster.
Want to put this into practice?
SideShift connects you with vetted UGC creators who actually deliver. Start your free trial and post your first job in under 10 minutes.
3. Do you need individual Instagram analytics tools?
Ideally, no. A good social media analytics dashboard allows you to connect multiple social media platforms, equally providing quality data from all of them. However, if your business exclusively focuses on Instagram, then a tool that focuses on this platform might be the best pick.
4. Where to find social media analytics dashboard templates?
You can build one using an AI tool, search for free templates on Google, or register for a free trial in a tool of your choice.