15 Influencer Marketing KPIs to Track
Tracking the wrong influencer marketing KPIs wastes budget. See the 15 metrics that actually predict success - and which vanity numbers to ignore.

Table of Contents
15 Influencer Marketing KPIs to Track in 2026
Many influencer campaigns end with a report full of numbers but no clear answer on performance. A campaign can generate thousands of engagements and still fail to deliver meaningful business results.
Follower counts get reported in decks. Likes get screenshotted. And somewhere between the brief and the debrief, the metrics that actually connect to business outcomes, such as cost per acquisition, conversion rate, and earned media value, get skipped entirely.
This guide covers the 15 influencer marketing metrics that actually matter, how to measure them, and which vanity numbers don’t belong in your reports.
Why Most Brands Track the Wrong Influencer Marketing Metrics
Vanity metrics are easy to collect and easy to present. Impressions, follower counts, and raw like totals look good in a slide but tell you very little about whether a campaign actually moved the needle.
The problem is structural. Many brands inherit their influencer reporting metrics from PR, where share of voice and reach have always been the primary currency. But influencer marketing, especially when content feeds into paid social, operates more like performance marketing. The metrics that matter are the ones tied to attention, intent, and action.
That doesn't mean reach is irrelevant. It means reach without context is incomplete. A post that reached 500,000 people but generated a 0.2% engagement rate and no click-through traffic tells a different story than one that reached 80,000 people, drove a 6% engagement rate, and sent qualified traffic to a product page.
The Influencer Marketing KPIs Worth Tracking
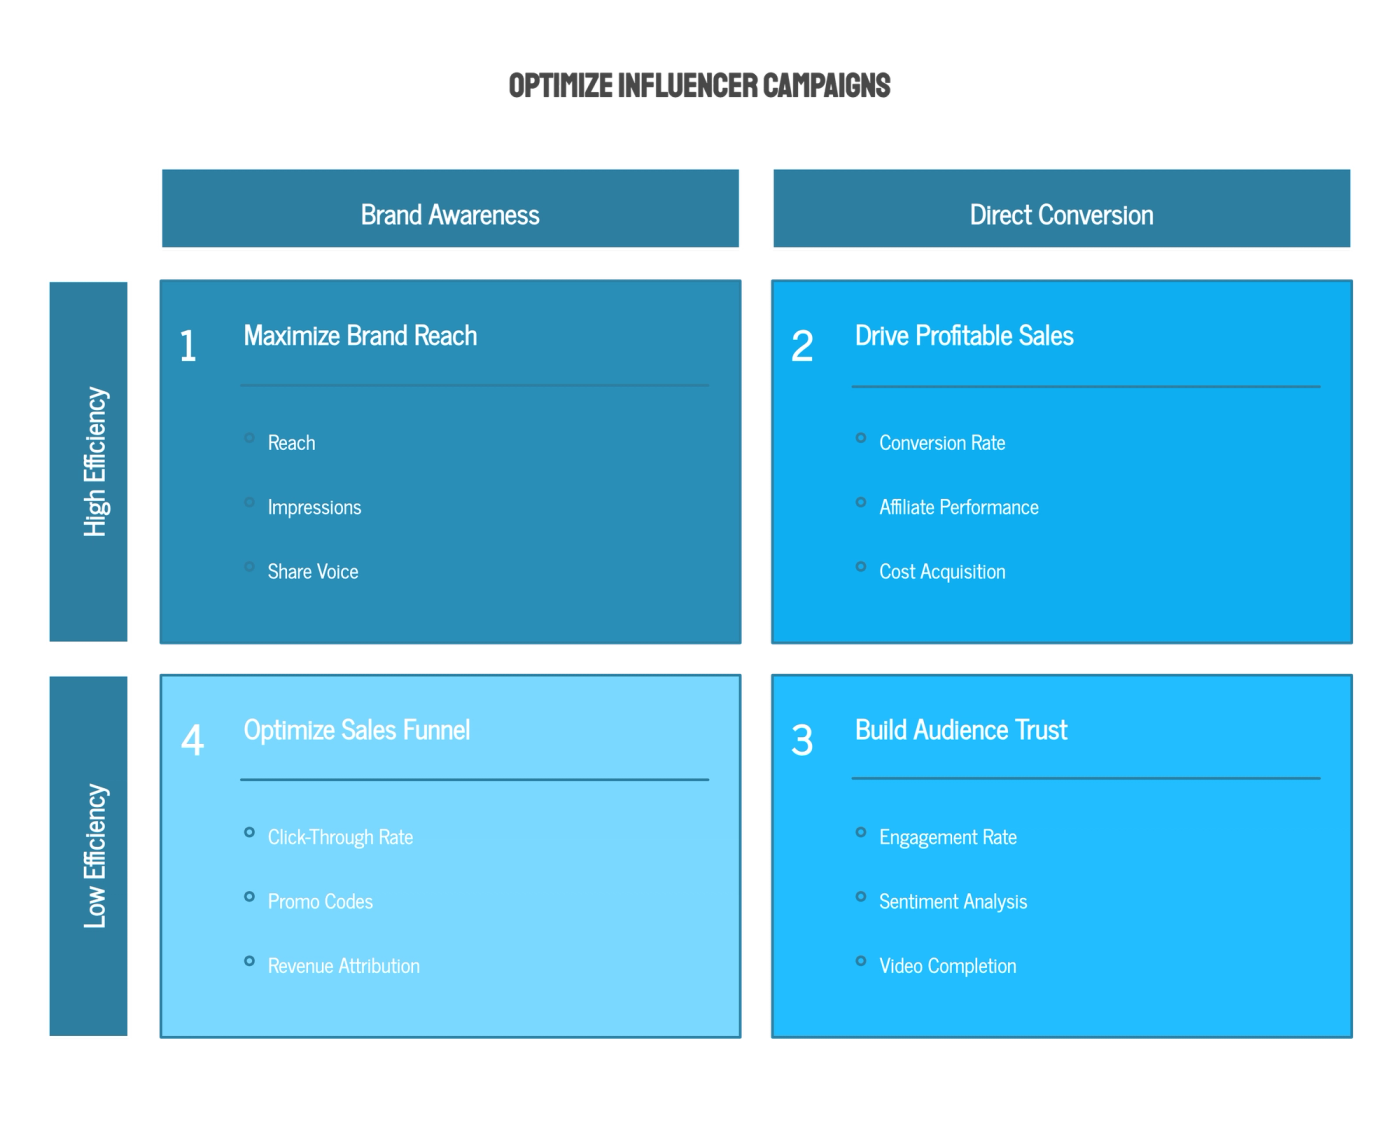
The 15 influencer campaign metrics below are organized into four categories: awareness, engagement, conversion, and efficiency. Most campaigns should be tracking at least one metric from each.
Awareness KPIs
Start with the top of the funnel. Awareness KPIs tell you how many people your campaign reached and how much visibility it generated. It’s the baseline any other metric builds on.
1. Reach
Reach measures the number of unique accounts that saw a piece of content. It's the most basic influencer marketing KPI and the right starting point for any awareness-focused campaign.
Watch for inflated reach numbers caused by bot-heavy audiences. Always pair reach with engagement rate to validate whether the audience is real and responsive.
2. Impressions
Impressions count total views, including multiple views from the same account. They will always be higher than reach, and the gap between the two can tell you something useful: a high impressions-to-reach ratio suggests people are watching content more than once, which is a positive signal for video content.
3. Share of Voice
Share of voice measures how much of the total conversation in your category your brand owns during a campaign period. It's more relevant for enterprise campaigns with a brand-building mandate than for direct response campaigns, but it's still a useful benchmark for tracking momentum over time.
4. Earned Media Value (EMV)
EMV assigns a dollar value to organic influencer content by comparing it to what the same reach and engagement would have cost in paid media. It's an imperfect metric and there's no universal formula, but it gives finance and leadership teams a useful frame of reference for reporting influencer campaign ROI against paid alternatives.
Want to put this into practice?
SideShift connects you with vetted UGC creators who actually deliver. Start your free trial and post your first job in under 10 minutes.
Engagement KPIs
Reach tells you how many people saw the content. Engagement tells you whether any of them cared. These metrics are where you start to separate a genuinely connected audience from an inflated follower count.
5. Engagement Rate
Engagement rate is the percentage of an audience that actively interacted with a piece of content through likes, comments, shares, and saves relative to reach or follower count. It's one of the most important influencer performance metrics for evaluating whether people are actually paying attention.
Industry benchmarks vary by platform and tier. Micro-influencers typically average 3-7% on Instagram and TikTok. Macro influencers tend to see 1-3%. Anything significantly below benchmark in a given niche is worth investigating before you renew a partnership.
6. Comments and Sentiment
Raw comment volume matters less than what those comments say. Sentiment analysis, even a manual read of comment tone on key posts, tells you whether an audience trusts the creator's recommendation or sees it as an obvious ad. Authentic responses, questions about the product, and personal stories in the comments are strong signals. Generic emoji responses and bot-pattern comments are not.
7. Saves and Shares
Saves and shares are the highest-intent engagement actions on most platforms because they require deliberate effort. A save signals that a viewer found the content useful enough to return to. A share signals they found it worth passing on. Both are strong indicators of content quality and audience relevance, and both feed algorithmic distribution.
8. Video Completion Rate
For short-form video content on TikTok, Instagram Reels, and YouTube Shorts, completion rate measures what percentage of viewers watched to the end. It's one of the clearest signals of hook and content quality, and it's a metric the platforms themselves use to determine distribution. A video with a 70%+ completion rate will get pushed to more feeds than one with 20%, regardless of how much was spent on production.
Conversion KPIs
This is where influencer marketing analytics get tied directly to business outcomes. Conversion KPIs measure whether the people who saw and engaged with the content actually did something, clicked, signed up, or bought.
9. Click-Through Rate (CTR)
CTR measures how many viewers took the step from watching content to visiting a URL, a product page, a landing page, or a sign-up form. It's the bridge between awareness and conversion, and it's where most influencer campaigns lose attribution if tracking isn't set up correctly upfront.
Use UTM parameters on every link and make sure each creator has a unique tracking URL. Without this, you're attributing traffic to “direct” or “social” with no way to tie it back to a specific creator or piece of content.
10. Conversion Rate
Conversion rate measures how many of those clicks resulted in a desired action like a purchase, a sign-up, a free trial, or a form submission. It's the most direct measure of whether influencer content is driving business outcomes, and it's the metric that most clearly separates high-performing creator partnerships from ones that generate noise but no pipeline.
Want to put this into practice?
SideShift connects you with vetted UGC creators who actually deliver. Start your free trial and post your first job in under 10 minutes.
When conversion rates are low despite strong click-through traffic, the problem is often the landing page, not the creator. Make sure the destination matches the promise in the content.
11. Promo Code and Affiliate Link Performance
Unique discount codes and affiliate links give brands a way to measure direct revenue attribution from individual creators. They're particularly useful for e-commerce campaigns where the path from content to purchase is short. Tracking promo code redemptions by creator also gives you a clean data set for comparing creator performance without relying on platform analytics.
12. Cost Per Acquisition (CPA)
CPA divides total campaign spend by the number of conversions generated. It's the single most useful influencer marketing ROI metric for direct-response campaigns because it puts creator performance in the same language as paid social, allowing for direct comparison between influencer spend and Meta or TikTok ad spend.
If your paid social CPA is $35 and your influencer CPA is $28, the business case for scaling the creator program writes itself.
Efficiency KPIs
Once you know what a campaign generated, you need to understand what it cost to generate it. Efficiency KPIs put spend in context and give you the benchmarks needed to compare influencer performance against other channels and justify scaling the program.
13. Cost Per Mille (CPM)
CPM measures the cost of reaching 1,000 people. It's a standard efficiency metric across all paid and earned media, and it's particularly useful for benchmarking influencer campaigns against paid alternatives.
Micro-influencer campaigns frequently deliver CPMs of $5-$15, compared to $15-$30 for Meta and TikTok paid ads, which is one reason brands are increasingly building creator programs alongside or instead of traditional paid social.
14. Return on Ad Spend (ROAS)
ROAS measures revenue generated per dollar spent on a campaign. It's most relevant for e-commerce brands with clear revenue attribution, and it requires clean tracking infrastructure to calculate accurately. A ROAS of 3x or higher is generally considered a strong benchmark for influencer campaigns, though this varies significantly by category, margin, and campaign objective.
15. Content Reuse Rate
Content reuse rate measures how much of the UGC produced in a campaign gets repurposed across other channels like paid ads, organic social, email, and product pages. It's an underreported efficiency metric, but it's one of the most compelling arguments for building a creator program.
Content that performs organically and then gets whitelisted or boosted as a paid ad effectively doubles its value. Brands running high-volume creator programs through platforms like SideShift generate a continuous library of licensed content that feeds multiple channels simultaneously, compressing the cost per asset significantly over time.
Which Influencer Marketing KPIs Should You Prioritize?
The right KPIs depend on what you're trying to achieve.
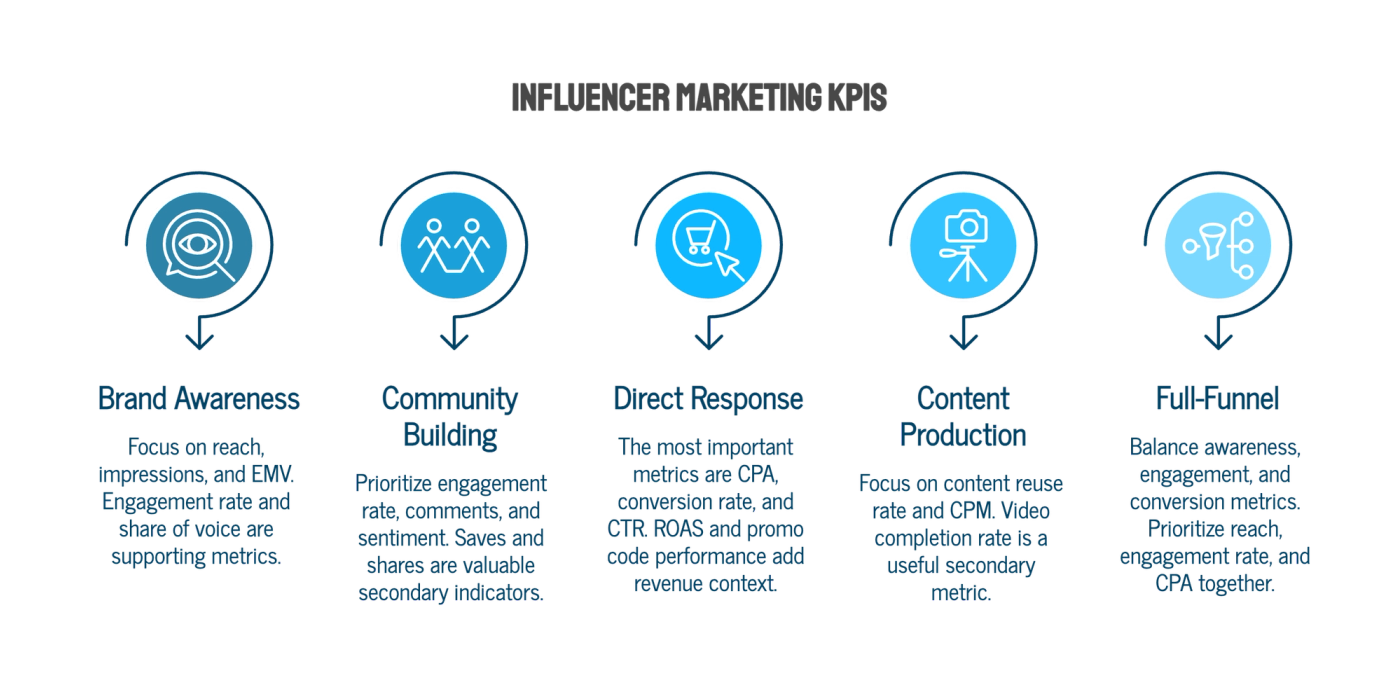
- For brand awareness campaigns, focus first on reach, impressions, and earned media value (EMV), with engagement rate and share of voice as supporting metrics.
Want to put this into practice?
SideShift connects you with vetted UGC creators who actually deliver. Start your free trial and post your first job in under 10 minutes.
- For community-building campaigns, prioritize engagement rate, comments, and sentiment, with saves and shares are valuable secondary indicators.
- For direct response campaigns, the most important metrics are cost per acquisition (CPA), conversion rate, and click-through rate (CTR). ROAS and promo code performance can add revenue context and creator-level attribution.
- For campaigns centered on content production, focus on content reuse rate and cost per thousand impressions (CPM), with video completion rate as a useful secondary metric.
- For full-funnel campaigns, balance awareness, engagement, and conversion metrics by prioritizing reach, engagement rate, and CPA together.
Most campaigns benefit from tracking at least one metric from each category, even if the primary objective sits in one column. A direct response campaign that ignores engagement rate will miss early signals that content isn't resonating, which could have been caught and corrected mid-campaign.
How to Build an Influencer Marketing Reporting Dashboard
Tracking influencer campaign metrics across multiple creators and platforms manually doesn't scale. Here's a baseline reporting setup that works for most brand teams:
- UTM tracking on every link: Every creator gets a unique UTM parameter so traffic, CTR, and conversion data can be attributed at the creator level in Google Analytics or your analytics platform of choice.
- Platform analytics exports: Pull native analytics from TikTok, Instagram, and YouTube at the end of each campaign window. Most platforms provide reach, impressions, engagement, video views, and completion rate at the post level.
- Promo codes by creator: If the campaign includes a purchase conversion goal, unique promo codes give you clean revenue attribution without relying on click tracking alone.
- A single reporting template: Consolidate all of the above into one document that maps creator spend against each KPI. Over time, this becomes a benchmark database that makes future creator selection and budget allocation far more data-driven.
Platforms like SideShift centralize campaign management, content approval, and performance tracking in one place which removes the manual overhead of consolidating data across spreadsheets and platform exports.
Track Influencer Marketing KPIs With SideShift
Defining the right influencer marketing KPIs before a campaign launches is what separates brands that scale creator programs from brands that run one-off campaigns and struggle to justify the spend. The 15 metrics above give you a complete framework, but the infrastructure behind them matters just as much as knowing which numbers to track.
SideShift gives brands everything needed to run measurable, high-volume creator campaigns in one place. Brands can post a brief, match with vetted creators from a network of 800,000+, manage contracts and approvals, and track performance without stitching together five different tools or managing creator relationships over Instagram DMs.
FAQs
1. What are the most important influencer marketing KPIs?
The most important KPIs depend on your campaign objective. For awareness campaigns, reach and impressions matter most. For direct response, focus on CPA, conversion rate, and ROAS. For any campaign, engagement rate and video completion rate are reliable signals of content quality regardless of objective.
Want to put this into practice?
SideShift connects you with vetted UGC creators who actually deliver. Start your free trial and post your first job in under 10 minutes.
2. How do you measure influencer marketing ROI?
Influencer marketing ROI is most accurately measured through CPA and ROAS, both of which require UTM tracking, unique promo codes, or affiliate links to attribute conversions back to individual creators. EMV is a useful secondary metric for campaigns where direct revenue attribution isn't possible.
3. What is a good engagement rate for influencer marketing?
Benchmarks vary by platform and creator tier. Micro-influencers typically average 3-7% on Instagram and TikTok. Macro influencers average 1-3%. Anything below 1% on a campaign post warrants a closer look at audience quality and content relevance.
4. What's the difference between reach and impressions in influencer marketing?
Reach counts unique accounts that saw a piece of content. Impressions count total views, including multiple views from the same account. Impressions will always be equal to or higher than reach. A high impressions-to-reach ratio on video content usually indicates strong replay behavior.
5. How do you track influencer marketing performance across multiple creators?
The most reliable approach combines UTM parameters for click and conversion tracking, unique promo codes for revenue attribution, native platform analytics for engagement data, and a centralized reporting template that maps all of the above against spend at the creator level. Platforms like SideShift consolidate this into a single dashboard, removing the need to manually aggregate data across sources.