What is a Good ROAS? 2026 Benchmarks by Industry
A good ROAS typically ranges from 2:1 to 4:1, but it varies by industry. See 2026 benchmarks and find the return on ad spend you should target.
Table of Contents
Every growth lead asks it. Every founder obsesses over it. Every paid media dashboard revolves around it: “What is a good ROAS?”
In this guide, we’ll explain what ROAS actually measures, provide 2026 benchmarks by industry, show how to determine if your ROAS is profitable, and share strategies to improve it effectively.
What is ROAS?
ROAS (return on ad spend) measures the revenue generated for every dollar spent on ads.
Formula:
ROAS = Revenue ÷ Ad Spend
Example:
$10,000 revenue from $2,000 ad spend
ROAS = 5.0 (or 5:1) → You earn $5 for every $1 spent
What Is a Good ROAS in 2026?
Most marketers consider a ROAS between 2:1 and 4:1 to be “good.” That’s a rough baseline, but true profitability depends on context. While more output for less input is always better, a healthy ROAS can vary widely depending on your business model.
HubSpot’s performance data shows that B2B companies often target ROAS benchmarks between 4:1 and 10:1 due to higher margins and longer sales cycles. But, there’s no one-size-fits-all answer. ROAS must be evaluated on a case-by-case basis, taking into account costs, product pricing, and growth strategy.
- High-margin products may be profitable at 2:1.
- Subscription brands might start at 1.5:1 while building customer lifetime value (LTV).
- Low-margin retail often needs 5:1 or higher just to break even.
Instead of chasing a generic number, ask yourself: “What ROAS is profitable for my business?” It’s always case by case.
If your digital advertising and UGC campaigns focus on goals like follower growth, brand awareness, or engagement rather than direct purchases, your return isn’t necessarily a dollar value and won’t be reflected in ROAS.
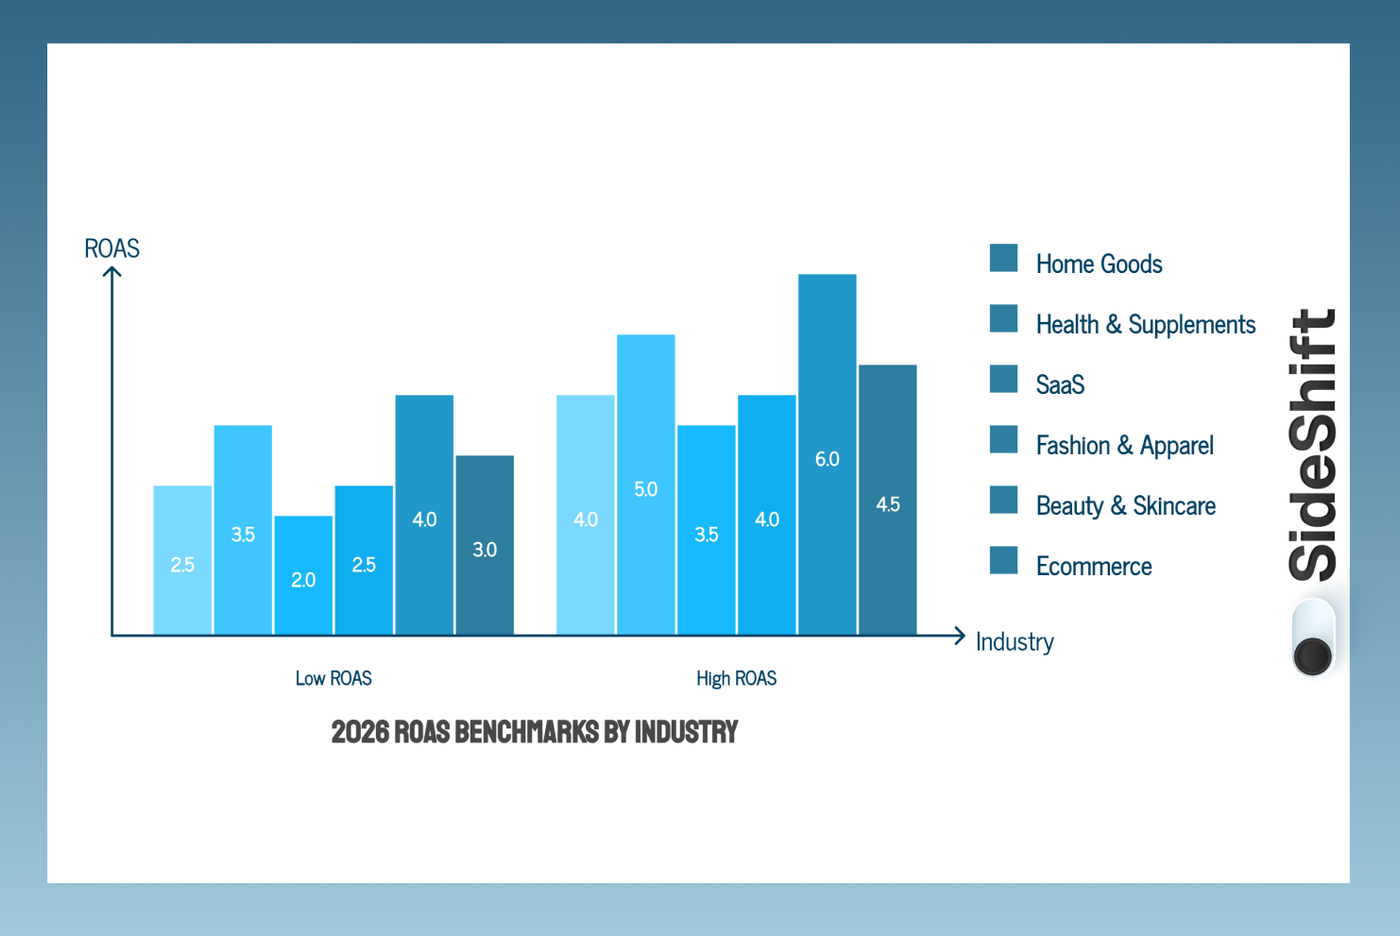
ROAS Benchmarks 2026: Average ROAS by Industry
Here’s a snapshot of expected ROAS ranges for 2026 across common sectors:
- Ecommerce (General): 3.0 - 4.5 → Highly competitive; creative quality matters
- Beauty & Skincare: 4.0 - 6.0 → Strong repeat purchase potential
- Fashion & Apparel: 2.5 - 4.0 → Margin dependent
- SaaS: 2.0 - 3.5 → Long LTV cycles
- Health & Supplements: 3.5 - 5.0 → High AOV potential
- Home Goods: 2.5 - 4.0 → Seasonal volatility
Benchmarks vary by ad platform, too: Facebook, Google, and TikTok all have different performance norms.
Facebook Ads ROAS Benchmarks
Median ROAS across industries tends to sit around ~2.2x on average, though strong e‑commerce or retargeting campaigns can push 3x - 5x or higher depending on funnel stage and creative quality.
Google Ads ROAS Benchmarks
Google often delivers higher ROAS than Meta because it captures users with search intent. Typical blended averages are around ~3.5x - 5x, with search and shopping campaigns sometimes reaching 4x - 8x+ in strong performing categories (like ecommerce).
TikTok Ads ROAS Benchmarks
TikTok’s ROAS is usually lower on average than Google or Facebook, often around ~1.5x - 3.5x, but this varies widely with creative effectiveness and audience fit. High‑performing campaigns in beauty or fashion can also exceed the median.
Profitable ROAS Ratio: How to Know Yours
ROAS alone doesn’t guarantee profit. To determine a profitable ROAS, you need to factor in all costs beyond just the product price, including:
Want to put this into practice?
SideShift connects you with vetted UGC creators who actually deliver. Start your free trial and post your first job in under 10 minutes.
- Product margin
- Cost of goods sold (COGS)
- Shipping
- Payment processing
- Creative production costs
- Agency or platform fees
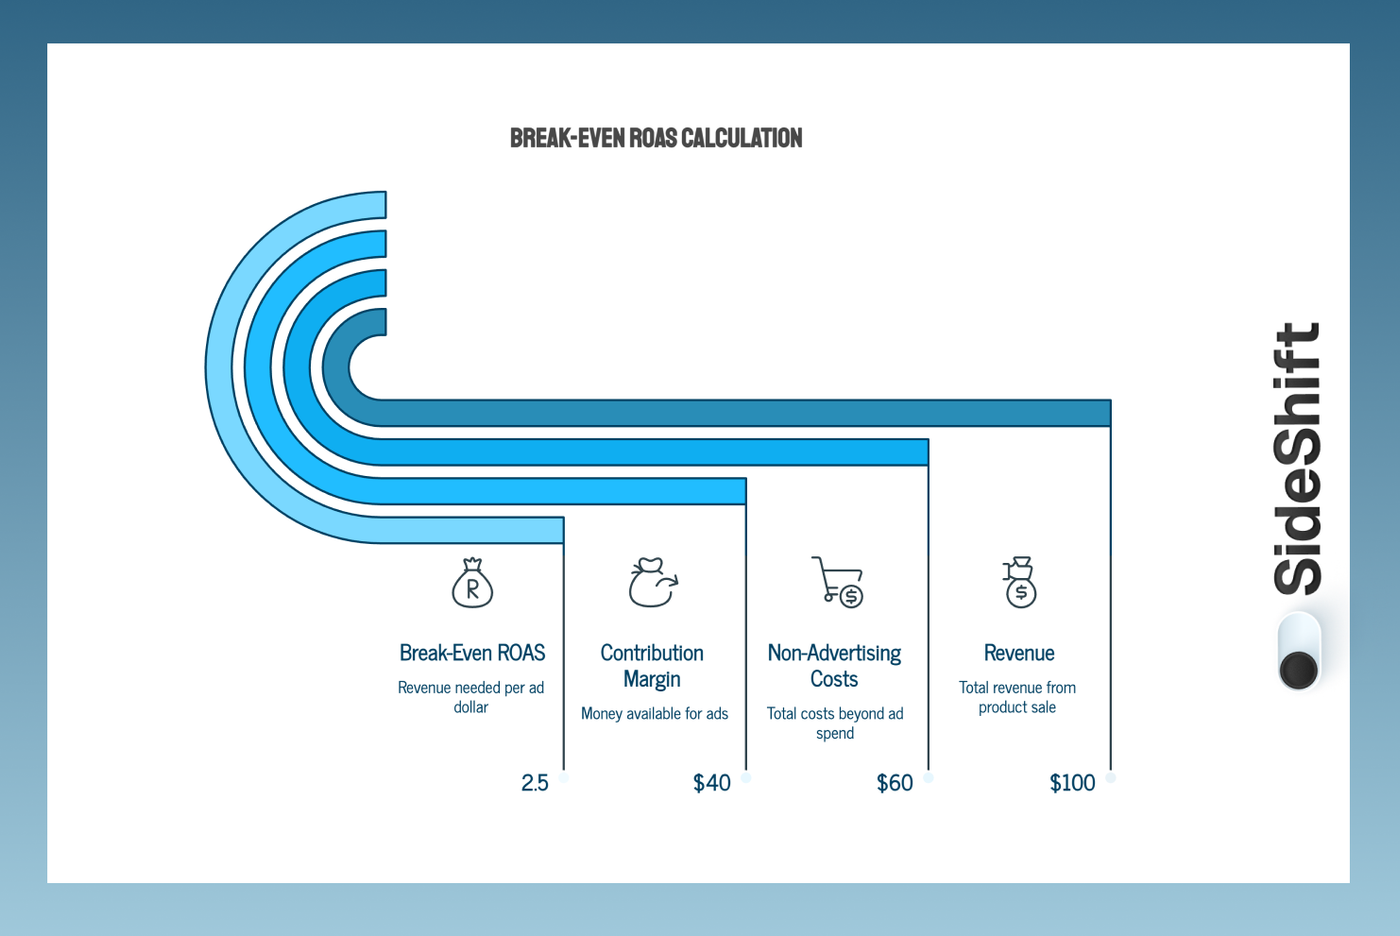
Example: Calculating Break-Even ROAS
Suppose you sell a product for $100. Your costs are:
- COGS: $40
- Shipping: $10
- Overhead (rent, salaries, tools, etc.): $10
This means your total non-advertising costs are $60. The remaining contribution margin (the money available to spend on ads) is $100 - $60 = $40.
Breakeven ROAS = Ad Spend / Revenue = 40 / 100 = 2.5
This means for every $1 spent on ads, you must earn $2.50 in revenue to break even. Anything above this is profit.
Many brands misinterpret ROAS by ignoring these additional costs and assuming a 3.0 ROAS is “good”, when in reality it may barely cover expenses.
Calculate a break-even ROAS for your campaign to determine a healthy KPI. It shows the minimum return needed to cover your costs. Any ROAS above this number equals profit.
Paid Ads Performance Metrics That Matter Beyond ROAS
ROAS is essential, but sometimes paints an incomplete picture of success. Smart brands track multiple KPIs:
- MER (Marketing Efficiency Ratio)
- CAC (Customer Acquisition Cost)
- LTV (Customer Lifetime Value)
- Contribution margin
- Average order value (AOV)
- Creative hold rate
- CTR & hook rate
A high ROAS with low volume may underperform a slightly lower ROAS paired with strong repeat purchases and LTV. Context always beats vanity metrics.
Improve ROAS with UGC on SideShift
Traditional paid ads alone won’t unlock sustainable ROAS growth. High-quality UGC content can make ads more persuasive, authentic, and scalable.
With SideShift, brands can:
- Recruit creators at scale
- Produce authentic, short-form content aligned with campaigns
- Test multiple ad variations quickly
- Measure revenue impact per creator or content piece
By combining paid media with creator-led content, brands maximize ad efficiency and turn every dollar spent into measurable revenue growth.
Start boosting your ROAS with high-volume UGC on SideShift and turn your campaigns into a scalable growth engine.
Start your free trial on SideShift today.
FAQs
1. What is considered a good ROAS in ecommerce?
It varies by industry, margin, and business model. Most brands target 2:1 - 4:1 as a starting point, but profitable ROAS depends on costs, product margins, and customer LTV.
2. How do you calculate ROAS?
ROAS = Revenue ÷ Ad Spend
3. What are the average ROAS benchmarks by industry in 2026?
- Ecommerce: 3 - 4.5
- Beauty: 4 - 6
- Fashion: 2.5 - 4
- SaaS: 2 - 3.5
- Health & Supplements: 3.5 - 5
- Home Goods: 2.5 - 4
4. Is a 2:1 ROAS profitable?
It can be if margins are high and costs are low. For low-margin products, 2:1 may not cover COGS and advertising expenses. Always calculate contribution margin to determine profitability.
5. How can I improve my ROAS quickly?
- Optimize creative with authentic, high-quality content
- Leverage UGC to boost ad trust and engagement
- Test multiple ad variations to find high-performing messages
Want to put this into practice?
SideShift connects you with vetted UGC creators who actually deliver. Start your free trial and post your first job in under 10 minutes.
- Track performance across KPIs (LTV, AOV, CTR) rather than ROAS alone