Creative Analytics: Measure & Optimize Ad Performance
Creative analytics tracks metrics like CTR, retention, and CPA to identify winning ads, reduce wasted spend, and improve performance through continuous testing.

Table of Contents
Most ad budgets fail because the creative isn't working, not because of targeting. Creative analytics is the discipline of measuring exactly how individual ad creatives perform, identifying what's driving results versus draining budget, and using that data to make faster, smarter decisions about what to produce next.
This guide walks through the metrics that matter, how to build a measurement process that actually surfaces actionable insight, and how high-volume UGC changes the creative optimization game entirely.
Key Creative Metrics to Track
Not every metric in your ads dashboard needs equal attention. The goal of creative analytics is to connect content output to business outcomes, and that requires focusing on the signals that actually predict performance.
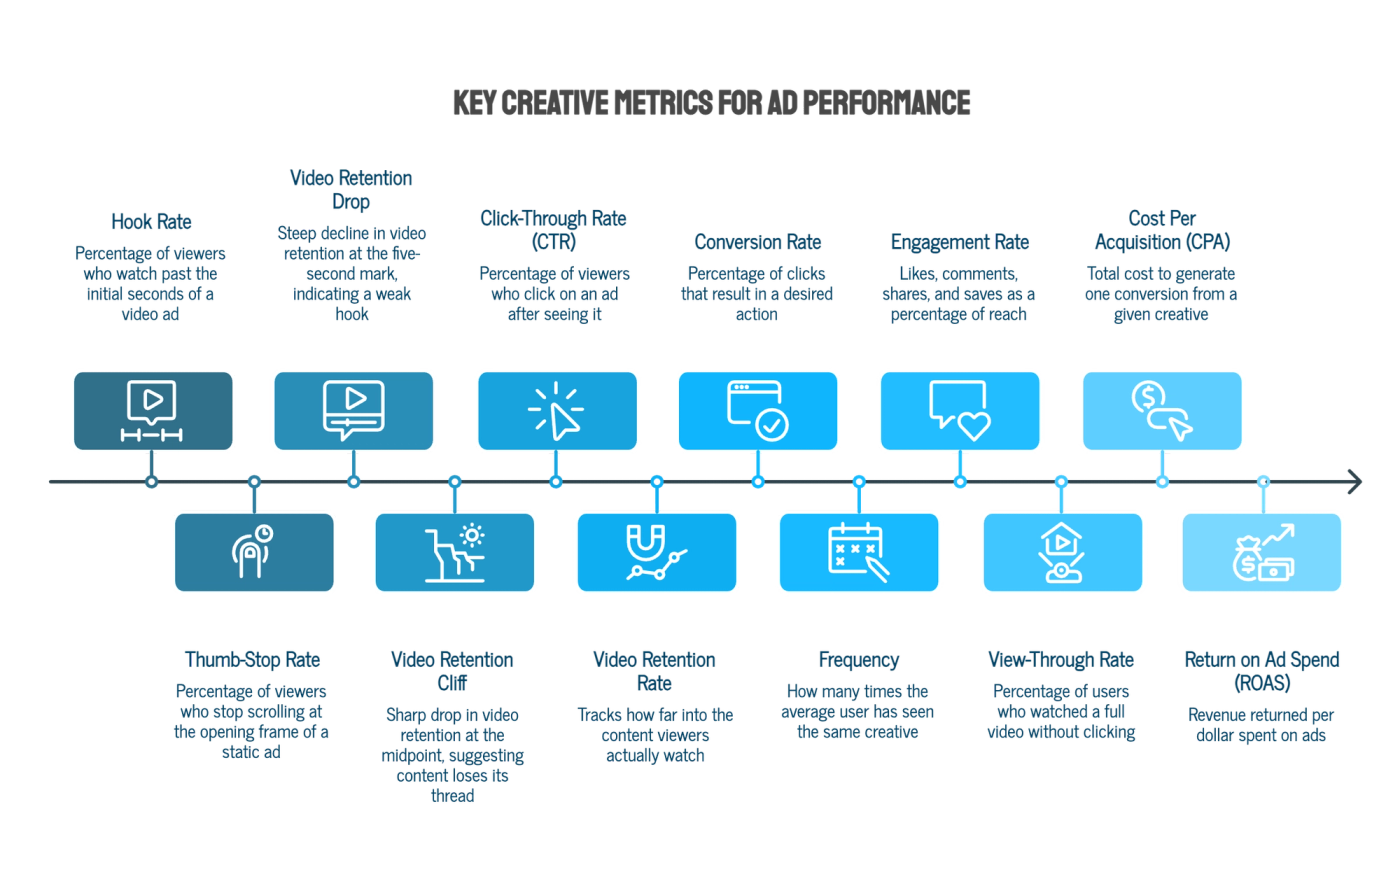
Hook Rate and Thumb-Stop Rate
Before any other metric matters, people have to stop scrolling. Hook rate measures the percentage of viewers who watch past the first two to three seconds of a video ad.
Thumb-stop rate captures the same concept across static formats. Low hook rate means the opening frame or headline isn't doing its job, and no amount of optimization downstream fixes a creative that loses 90% of its audience before the message lands.
Click-Through Rate (CTR)
CTR measures how often people who see your ad click through to your site, product page, or landing page. It's the most direct signal of whether the creative is generating intent, not just impressions.
A high CTR relative to your category benchmark tells you the messaging and format are resonating. A low CTR despite solid reach means the creative is visible but not compelling.
Video Retention Rate
For video ads, the retention rate tracks how far into the content viewers actually watch. A steep drop at the five-second mark points to a weak hook. A cliff at the midpoint suggests the content loses its thread before delivering the payoff. Retention curves give you a frame-by-frame map of where the creative earns attention and where it loses it.
Cost Per Acquisition (CPA) and Return on Ad Spend (ROAS)
CTR tells you about interest. CPA and ROAS tell you about results. CPA measures the total cost to generate one conversion from a given creative. ROAS measures revenue returned per dollar spent.
These are the metrics that make the connection between creative performance and actual business outcomes. A creative with a high CTR but poor CPA is entertaining but not converting. A creative with a modest CTR but strong CPA is doing exactly what it should.
Additional Metrics Worth Tracking:
- Conversion rate: The percentage of clicks that result in the desired action (purchase, sign-up, etc.)
- Frequency: How many times the average user has seen the same creative. Rising frequency alongside declining CTR is a reliable signal of creative fatigue.
- Engagement rate: Likes, comments, shares, and saves as a percentage of reach. High engagement on organic UGC often predicts strong performance when that content is amplified through paid.
- View-through rate: The percentage of users who watched a full video without clicking, still a signal of content quality even without direct conversion intent.
Want to put this into practice?
SideShift connects you with vetted UGC creators who actually deliver. Start your free trial and post your first job in under 10 minutes.
How to Measure Creative Performance (Step-by-Step)
Having the right metrics is one thing. Building a process that turns those metrics into decisions is where most teams fall short.
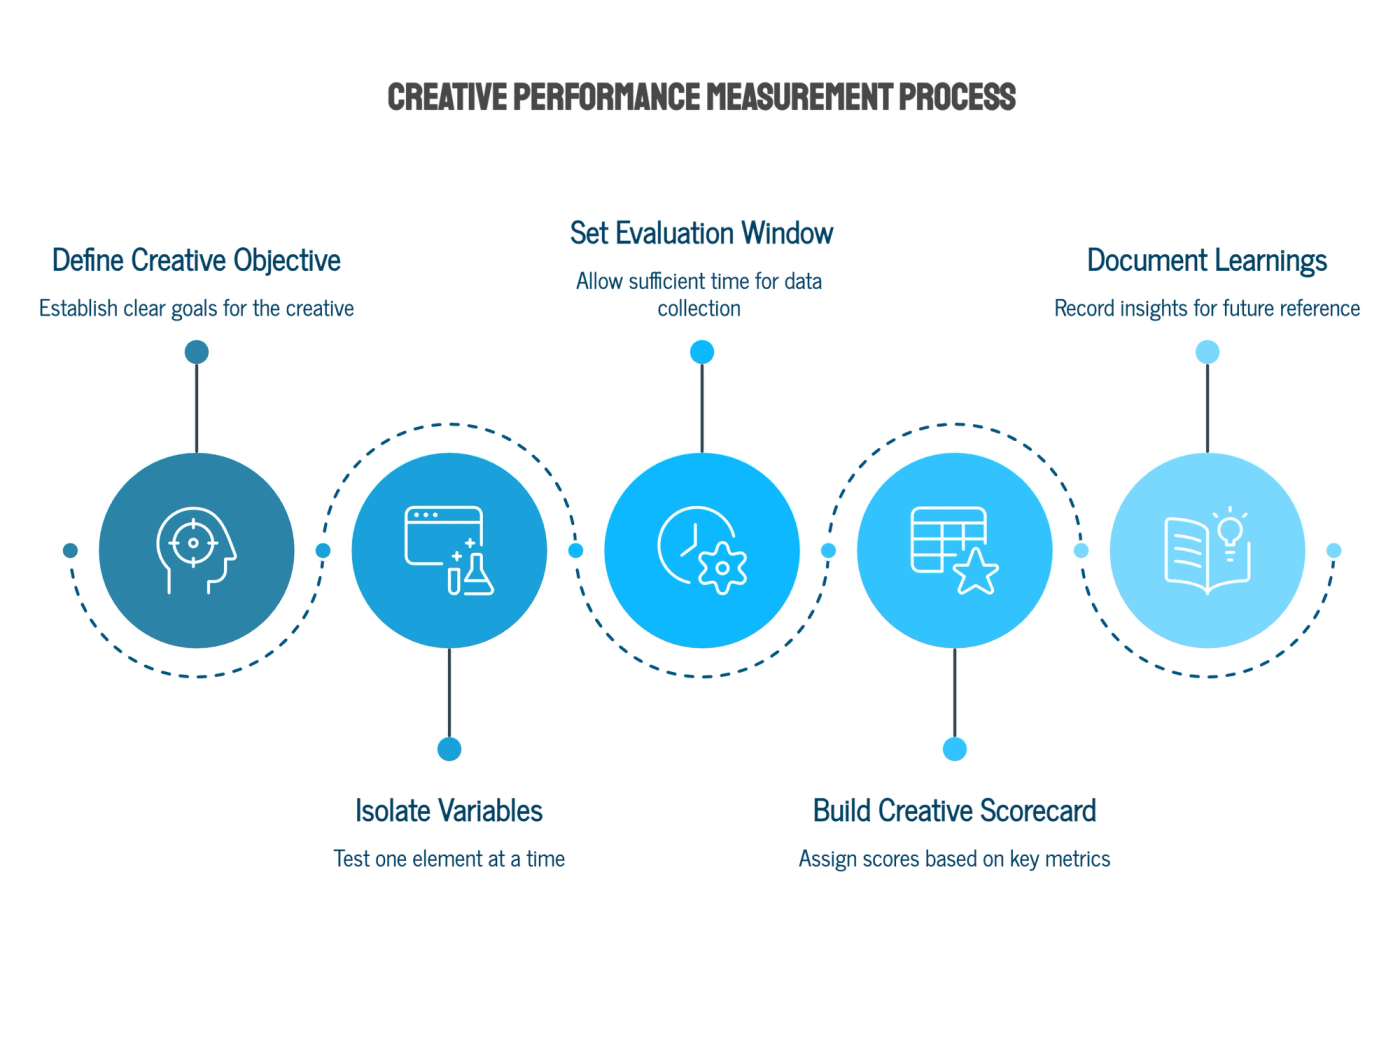
Step 1: Define your creative objective before you run anything.
Brand awareness, lead generation, and direct purchase all require different measurement frameworks. Trying to evaluate a top-of-funnel awareness creative against a CPA benchmark is a category error that leads to bad conclusions.
Step 2: Isolate variables in your creative tests.
If you change the hook, the visual format, and the call-to-action simultaneously, you can't tell which change drove the performance difference. Test one variable at a time: hook vs. hook, format vs. format, offer vs. offer. This is where most brands underinvest. They launch ads and optimize budgets rather than learning from creative differences.
Step 3: Set a meaningful evaluation window.
Creative performance data in the first 24 to 48 hours is often noisy. Give each creative enough time and spend to exit the learning phase before concluding. For most campaigns, that means at least three to five days and a minimum of 50 to 100 conversions per variation before declaring a winner.
Step 4: Build a creative scorecard.
Assign each creative a score across your key metrics: hook rate, CTR, CPA, ROAS. This makes comparison across large creative libraries manageable and surfaces patterns that are hard to spot when reviewing individual ads in isolation.
Step 5: Document what you learn.
A creative that wins a test is valuable. Understanding why it won is more valuable. Note what was different: the tone, the format, the opening line, the type of creator, the use of text on screen. Over time, this knowledge base becomes a repeatable framework for producing content that performs.
Advanced Creative Analysis Techniques
Once the basics are in place, several methods meaningfully sharpen your creative intelligence.
Pattern Recognition Across Winners
When you have a large enough sample of top-performing creatives, patterns emerge that individual ad analysis misses. Common threads might be conversational hooks that outperform product-first hooks, creators filmed in natural settings versus studio setups, or a specific emotional tone (urgency vs. relatability vs. humor) that consistently drives better CPA in your category.
Systematically tagging and categorizing creatives by these attributes turns your ad library into a strategy document.
Creative Fatigue Monitoring
Every creative has a performance shelf life. The signal to watch is frequency rising while CTR and conversion rate decline on the same audience segment. This combination indicates the audience has seen the ad enough times that it has stopped registering.
Fatigue happens faster at higher spend levels, which is why high-volume creative production is a structural advantage rather than a nice-to-have at scale.
Holdout Testing for Incrementality
Standard attribution models tell you which creatives got credit for conversions. Holdout testing tells you which creatives actually caused them. By withholding ads from a control group and comparing conversion rates, you can measure the true incremental lift driven by your creative rather than the conversions that would have happened anyway.
Want to put this into practice?
SideShift connects you with vetted UGC creators who actually deliver. Start your free trial and post your first job in under 10 minutes.
Common Creative Analytics Mistakes to Avoid
The measurement infrastructure is only as useful as the decisions it informs. These are the errors that consistently undermine creative analytics programs.
- Optimizing for CTR alone: High CTR with poor CPA usually means the creative is attracting clicks from an audience that has no intention of converting. CTR is a leading indicator, not a final verdict.
- Killing creatives too early: Pulling an ad after two days because it hasn't hit target CPA is a common mistake that kills creatives during the learning phase before they've had a fair evaluation window.
- Testing too many variables at once: Without creative isolation, test results are uninterpretable. You'll know something worked. You won't know what.
- Ignoring qualitative signals: Comments, shares, and the way people talk about your content in replies contain creative intelligence that quantitative dashboards miss entirely. If people are tagging friends or saving the video, that's a signal worth integrating.
- Treating every platform the same: A creative that performs on Meta won't automatically translate to TikTok. Platform-specific consumption behavior, format expectations, and algorithm mechanics mean that creative analysis should be siloed by platform before insights are generalized.
How to Optimize Ad Creative Using Data
Creative analytics produces insight. Creative optimization puts that insight to work. The feedback loop should be continuous: run, measure, learn, produce, repeat.
The brands getting the most out of this cycle share a few operational characteristics. They maintain a high creative output cadence, so the testing surface is always expanding. They have clear criteria for what constitutes a winning creative before the test runs, so decisions aren't made by gut after the fact. And they treat creative production as a volume game, because the more variations you can test, the faster you find what works.
This is where UGC changes the math. Traditional ad creative production through agencies is expensive and slow, which creates pressure to make each creative "the one" before it runs.
That pressure produces overproduced, over-refined content that often performs worse than something more authentic and immediate. UGC creators, particularly at volume, reduce the cost and time per creative significantly, which makes genuine iterative testing economically viable.
Here’s an example of a practical optimization workflow:
- Pull your top 20% of creatives by ROAS or CPA over the past 30 days
- Identify shared attributes like format, hook style, creator type, tone, and offer framing
- Brief new creative variations that iterate on those winning attributes
- Pause the bottom 20% of performers and reallocate the budget toward proven concepts
- Repeat monthly, building a creative library that compounds rather than starts from scratch each cycle
Optimize Ad Creative with SideShift
If your creative analytics process keeps surfacing the same problem of not enough winning variations, creative fatigue setting in faster than new content can replace it, or no systematic way to connect content output to paid performance, the bottleneck is usually creative volume. You can't run a rigorous testing program on three ads a month.
SideShift solves the volume problem. By connecting brands with over 800,000 U.S.-based Gen Z creators, SideShift makes it operationally realistic to produce hundreds of creative variations per month, test them systematically, and replace fatigued content before it drags down campaign performance. The platform handles job posting, creator recruitment, briefs, contracts, payments, and campaign analytics in one place, so the feedback loop between "what's performing" and "what to produce next" actually closes in real time rather than getting lost across disconnected tools.
Want to put this into practice?
SideShift connects you with vetted UGC creators who actually deliver. Start your free trial and post your first job in under 10 minutes.
For brands running paid social at any meaningful scale, the cost of not having enough creative to test is almost always higher than the cost of the platform.
Build your creative engine for free on SideShift today.
FAQs
1. What is creative analytics in advertising?
Creative analytics is the practice of measuring how individual ad creatives perform using metrics like CTR, video retention, CPA, and ROAS to understand what's driving results and what's wasting budget. It turns ad performance data into specific, actionable decisions about what content to produce, test, and scale.
2. Which metrics are most important for creative performance?
The metrics that connect most directly to outcomes are hook rate (early retention), CTR, CPA, and ROAS. Hook rate tells you whether the creative earns attention. CTR tells you whether it generates intent. CPA and ROAS tell you whether it produces revenue efficiently. Tracking all four together gives a complete picture of creative health.
3. How do you use creative analytics to improve ads?
Start by identifying your top-performing creatives and the attributes they share: hook style, format, tone, and offer framing. Then, brief new variations that iterate on those winning attributes while testing one variable at a time. Pause low performers, reallocate budget toward proven concepts, and repeat the cycle monthly so your creative library compounds over time.
4. How often should ad creatives be refreshed?
Most brands at moderate spend levels need new creative every two to four weeks. At higher spend, fatigue can set in faster because frequency accumulates more quickly. The reliable signal is frequency rising while CTR and CPA worsen simultaneously on the same audience. When that pattern appears, the creative has run its course regardless of how recently it launched.
5. What tools are used for creative analytics?
Meta Ads Manager and TikTok Ads Manager both provide native creative performance breakdowns by ad unit. For brands running UGC at scale, SideShift layers campaign analytics and creator performance tracking on top of that, connecting content production directly to paid performance data so the feedback loop between creative output and media results stays closed.