


Engagement Rate: The Complete Guide for Brands & Creators (2026)
Engagement rate = (likes + comments + shares) / followers x 100. See the 2026 benchmarks by platform, tier, and industry - plus a free calculator.
Table of Contents
Is a 2% engagement rate good or bad? The frustrating answer is: it depends.
Brands reject creators with perfectly healthy engagement rates. Creators worry their content is underperforming when it's actually above average for their niche. And marketing teams compare Instagram, TikTok, LinkedIn, and YouTube engagement as if the numbers mean the same thing across platforms.
Engagement rate is one of the most widely used social media metrics, but it's also one of the most misunderstood. A 2% engagement rate on TikTok tells a very different story than a 2% engagement rate on Instagram. The formula hasn't changed, but the context around it matters.
This guide breaks down how to calculate engagement rate, what a healthy engagement rate looks like on each platform in 2026, how benchmarks shift by follower count, and what both brands and creators can do to improve performance. Whether you're evaluating a paid partnership or trying to grow your own account, the data below will give you a benchmark that's actually useful.
What Is Engagement Rate, Exactly?
Engagement rate measures how actively your audience interacts with your content relative to your total followers or reach. It's expressed as a percentage, and the standard formula looks like this:
(Likes + Comments + Shares) ÷ Followers × 100 = Engagement Rate
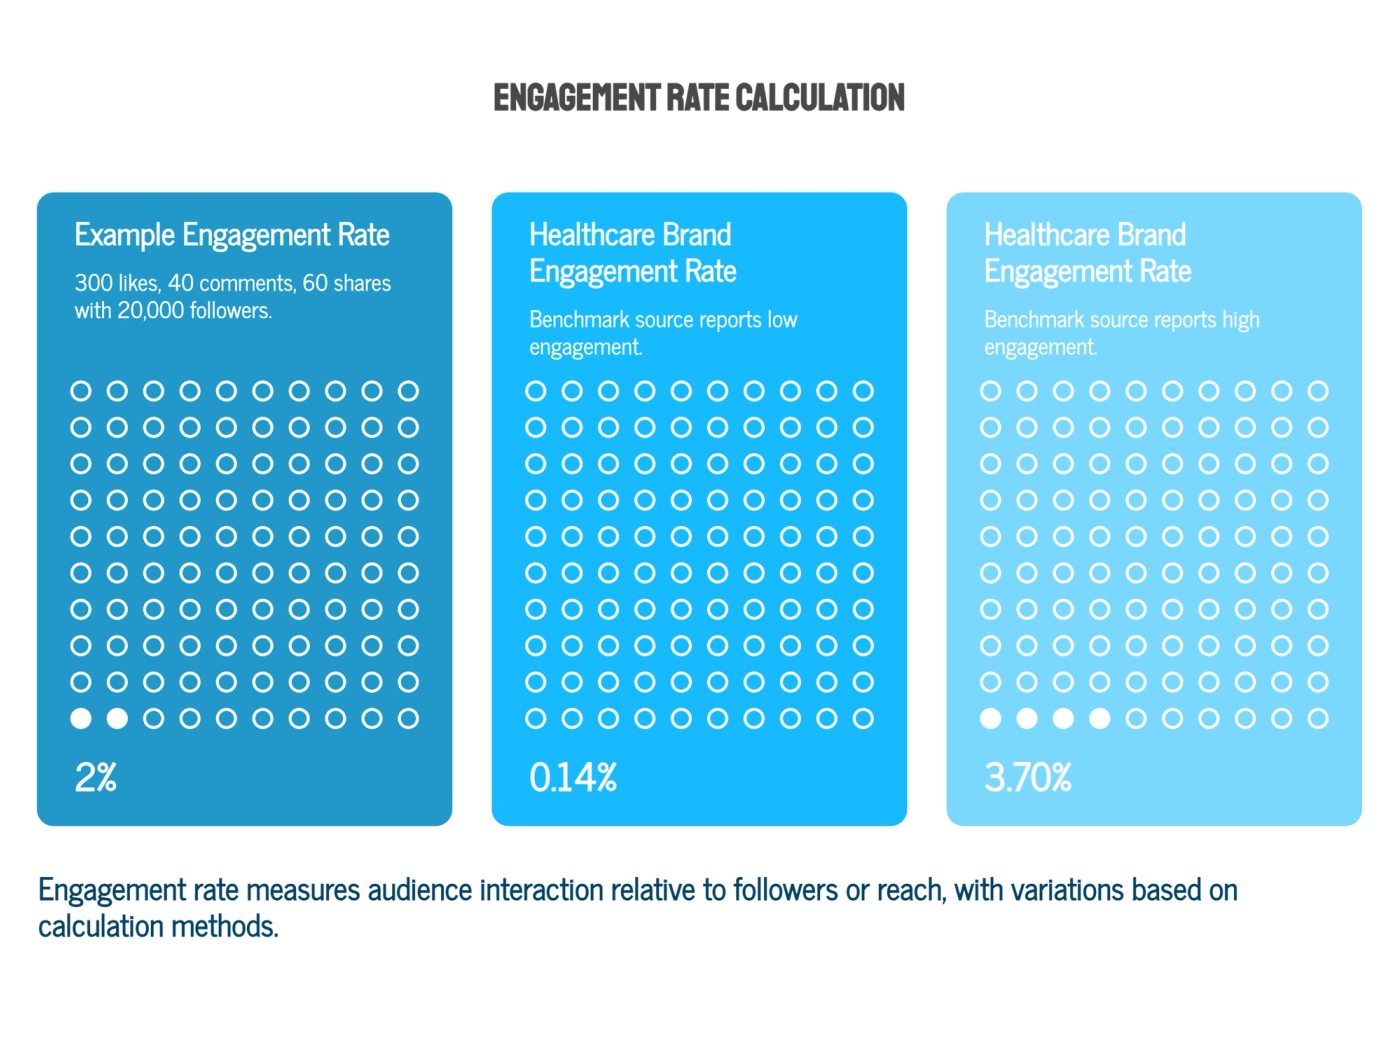
So if a post gets 300 likes, 40 comments, and 60 shares, and the account has 20,000 followers:
(300 + 40 + 60) ÷ 20,000 × 100 = 2%
Some tools and platforms extend this formula to include saves, video views, or story replies depending on the content format. That's worth knowing because it means engagement rate figures from different sources aren't always apples-to-apples. A healthcare-adjacent brand on Instagram might see one benchmark source report 0.14% while another reports 3.70% for the same industry, not due to a rounding difference, but because one measures by reach and the other by followers.
For creator benchmarking across campaigns, followers-based engagement rate is the standard. When you're evaluating how a specific piece of content performed with the people who actually saw it, reach-based engagement rate is the more honest signal.
Why Engagement Rate Matters More Than Follower Count
Follower count tells you how many people could see your content. Engagement rate tells you how many actually care.
Brands have become far less interested in follower count alone and far more focused on engagement rate when evaluating creator partnerships. A large audience can create reach, but engagement reveals whether that audience is actually paying attention. As creator marketing has matured, engagement rate has become one of the most important indicators of audience quality, content resonance, and partnership potential.
High follower counts can be bought or accumulated through viral moments that don't reflect the creator's typical audience relationship. Engagement rate, especially when measured consistently across multiple posts, is much harder to fake over time.
For brands running UGC campaigns specifically, this is where creator selection strategy lives or dies. A creator's value isn't determined solely by audience size alone, but by their ability to generate meaningful interaction and action from that audience.
Want to put this into practice?
SideShift connects you with vetted UGC creators who actually deliver. Start your free trial and post your first job in under 10 minutes.
How to Calculate Your Engagement Rate (With Examples)
Here are the three most common calculation methods, depending on what you're measuring:
1. Followers-Based ER (Best for creator benchmarking)
(Total Engagements ÷ Followers) × 100
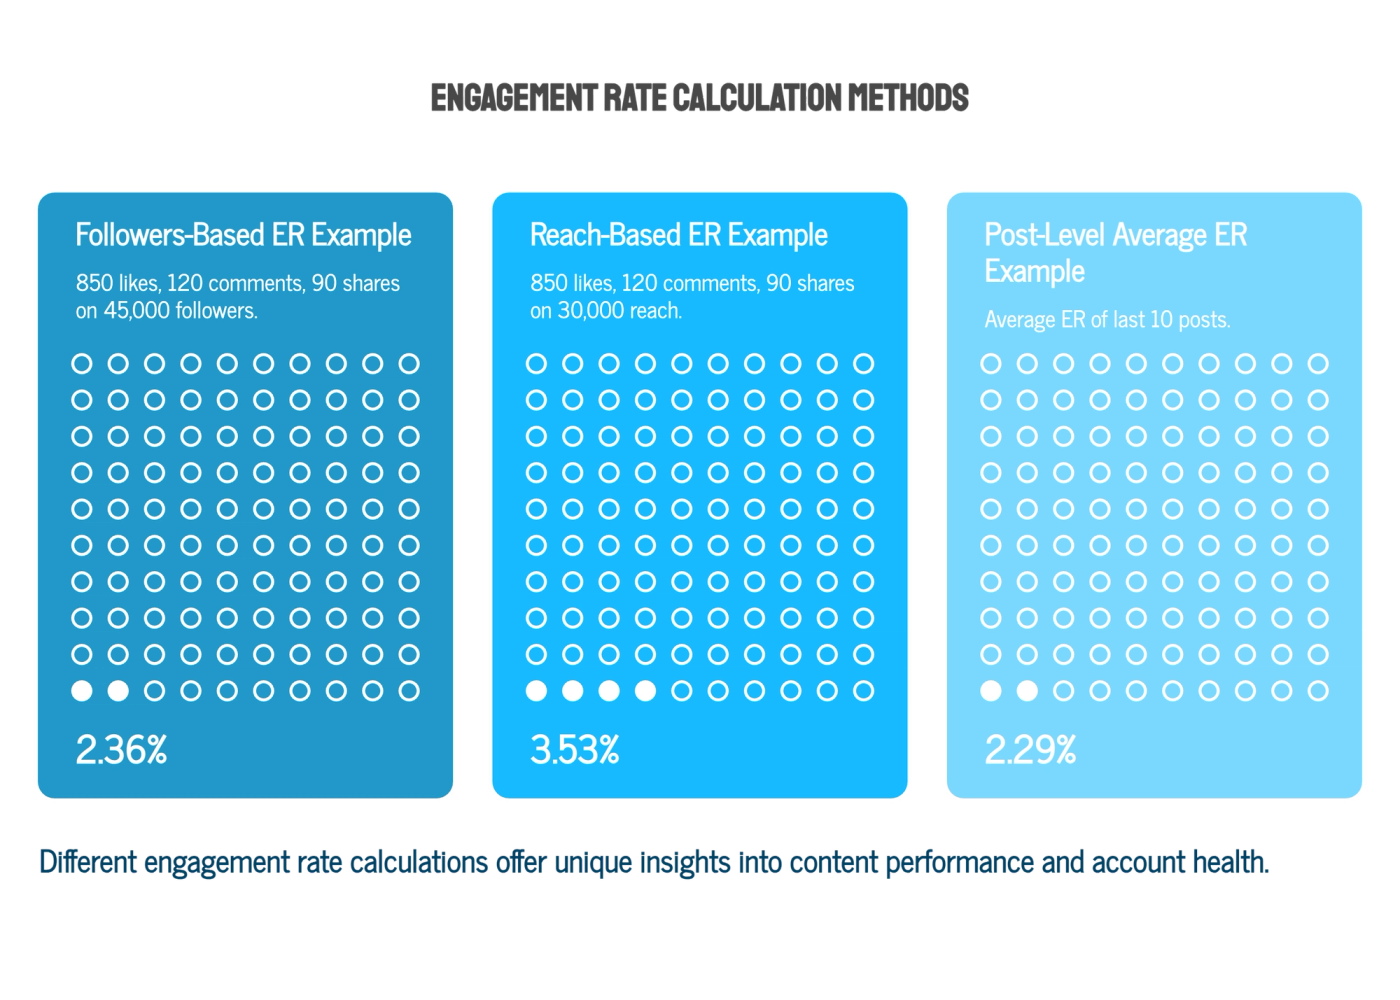
A quick example: a creator posts a Reel that gets 850 likes, 120 comments, and 90 shares. Their account has 45,000 followers.
(850 + 120 + 90) ÷ 45,000 × 100 = 2.36%
For context, that puts them in the mid-tier micro range, which is solid. On TikTok with the same numbers, that would read as below average. Platform matters.
2. Reach-Based ER (Best for content performance)
(Total Engagements ÷ Reach) × 100
Take that same Reel (850 likes, 120 comments, and 90 shares), but this time measure it against reach instead of followers. Say it reached 30,000 accounts (not just followers, since Reels get pushed to non-followers via Explore).
(850 + 120 + 90) ÷ 30,000 × 100 = 3.53%
Follower count doesn't factor in here at all. And notice this number comes out higher than the followers-based ER (2.36%) for the exact same post. That's expected. Reach-based ER isolates how well the content itself performed, independent of how big your following is. It's the better metric for comparing individual posts, especially Reels, since reach can include a huge pool of non-followers.
3. Post-Level Average ER (Best for account-wide analysis)
Add up the ER across your last 10-30 posts and divide by the number of posts.
Say you calculate the followers-based ER for your last 10 posts and get: 2.1%, 1.8%, 3.4%, 0.9%, 2.6%, 1.5%, 4.0%, 2.2%, 1.9%, 2.5%.
Sum = 22.9% ÷ 10 posts = 2.29% average ER
This smooths out one-off spikes or flops (like that 4.0% outlier or the 0.9% dud) and gives you a more reliable read on overall account health than judging yourself off a single post.
2026 Engagement Rate Benchmarks by Platform
Engagement rate benchmarks vary significantly by source, industry, audience size, and methodology. The figures below are intended as rough estimates of what brands and creators can generally expect to see across each platform.
- TikTok: 3.7% average (6%+ strong)
- Instagram: 0.5% average (1.5%+ strong)
- Facebook: 0.15% average (0.5%+ strong)
- LinkedIn: 1.5–6.5% average (3%+ strong)
- X: 0.12% average (0.5%+ strong)
- YouTube: 3–5% average (5%+ strong)
- Pinterest: 5.3% average (6%+ strong)
While platform averages provide a useful starting point, they rarely tell the full story. A creator's engagement rate is heavily influenced by audience size, content format, niche, and platform behavior. A 2% engagement rate might be exceptional for a creator with one million followers, while the same rate could be considered average for a creator with 10,000 followers.
Two platform trends are particularly important heading into 2026. First, TikTok continues to maintain some of the highest engagement rates in social media thanks to its discovery-first algorithm, which prioritizes content performance over follower count. Second, Instagram engagement extends beyond public metrics such as likes and comments. Saves, shares, story interactions, and direct messages can provide additional context about how audiences engage with content.
Want to put this into practice?
SideShift connects you with vetted UGC creators who actually deliver. Start your free trial and post your first job in under 10 minutes.
For that reason, engagement rate should always be evaluated within the context of the platform, creator size, and campaign objective rather than against a single universal benchmark.
Engagement Rate by Follower Count (2026 Benchmarks)
Comparing engagement rates across creators without accounting for audience size can be misleading. In general, engagement rates decline as follower counts increase. Smaller creators often have more concentrated audiences, stronger community relationships, and higher content relevance, while larger creators typically reach broader and more diverse audiences.
Instagram Engagement Rate by Follower Count
On Instagram, nano creators with 1,000 to 10,000 followers typically generate engagement rates between 4% and 6%. Micro creators with 10,000 to 50,000 followers generally see engagement rates between 2% and 4%, while mid-tier creators with 50,000 to 500,000 followers often fall between 1.5% and 3%.
As audiences continue to grow, engagement rates tend to decline. Macro creators with 500,000 to 1 million followers typically average between 1% and 2%, while celebrity accounts with more than 1 million followers often see engagement rates between 0.5% and 1%.
TikTok Engagement Rate
TikTok generally produces higher engagement rates across every audience tier. Nano creators commonly achieve engagement rates between 8% and 10%, while micro creators often fall between 6% and 8%. Mid-tier creators with audiences between 50,000 and 500,000 followers typically see engagement rates ranging from 4% to 6%.
Among larger creators, macro accounts often average between 2% and 4%, while celebrity creators with more than 1 million followers frequently generate engagement rates between 1% and 2%.
In practice, smaller creators tend to generate higher engagement rates than larger creators, though results vary by platform and niche. On Instagram, creators with fewer than 10,000 followers frequently generate the highest engagement rates on the platform, while TikTok tends to maintain stronger engagement across audience tiers, likely due in part to its discovery-driven content distribution model.
Three factors largely explain why engagement rates decline as follower counts grow. First, larger audiences are inherently more diverse, making it harder for every piece of content to resonate equally. Second, as audiences scale, a smaller percentage of followers see each post. Third, smaller creators often build their communities around highly specific niches, resulting in stronger audience relationships and more consistent interaction.
The key takeaway is that engagement should always be evaluated relative to audience size. A 5% engagement rate may be average for a nano creator but exceptional for a creator with one million followers. Likewise, a macro creator with a lower engagement rate may still drive significantly more total impressions, clicks, and conversions than a smaller creator.
What's a Good Engagement Rate for Brands vs. Creators?
The answer depends on what you're trying to do.
What Counts as a Good Engagement Rate for Creators
For creators, engagement rate is often used as a proxy for audience trust and community strength. While benchmarks vary, creators who consistently outperform others in their follower tier tend to be the most attractive partnership candidates.
Want to put this into practice?
SideShift connects you with vetted UGC creators who actually deliver. Start your free trial and post your first job in under 10 minutes.
As a general rule, creators should aim to outperform the average engagement rate for their follower tier and platform. Lower than average engagement rates may raise questions from potential brand partners, though expectations vary by niche. Highly specialized categories such as finance, wellness, and B2B often face greater scrutiny because audience quality matters as much as audience size.
Before entering a partnership, creators should ask brands what engagement rate they consider successful for the campaign. Establishing performance expectations and KPIs upfront helps avoid misalignment later, especially since engagement benchmarks vary significantly by platform, audience size, niche, and campaign objective.
What Counts as a Good Engagement Rate for Brands
For brands, engagement rate should be evaluated in the context of campaign goals, industry benchmarks, and content type rather than creator benchmarks alone.
A campaign generating engagement rates above category averages is generally a positive signal that the content is resonating with the intended audience. However, engagement should rarely be viewed in isolation. A campaign with a lower engagement rate may still outperform if it drives stronger click-through rates, conversions, or revenue outcomes.
The most effective marketers use engagement rate as a signal rather than a scorecard. High engagement suggests that content is capturing attention, generating conversation, and encouraging audience participation. Low engagement can indicate a mismatch between the content, creator, audience, or platform.
As influencer and UGC programs continue to mature, engagement rate remains one of the clearest indicators of audience resonance. Reach tells you how many people saw the content. Engagement helps reveal how many people cared enough to respond.
How to Increase Your Engagement Rate
There's no single tactic that guarantees higher engagement, but the accounts that consistently outperform their peers tend to follow the same principles.
Focus on Content Quality Before Posting Frequency
Posting more content doesn't automatically increase engagement. In many cases, publishing low-value content too frequently can have the opposite effect. Instead of focusing solely on volume, prioritize content that gives people a reason to stop scrolling, interact, or return for more.
A healthy content mix can also help. Videos, carousels, static images, Stories, and platform-specific formats each appeal to different audience behaviors and create multiple opportunities for engagement.
Create for the Platform You're On
Every platform rewards different behaviors. On Instagram, short-form video, collaborations, and shareable content tend to perform well. On TikTok, strong hooks and audience retention are often the difference between content that reaches a few hundred people and content that reaches thousands.
Rather than repurposing the exact same content everywhere, adapt it to the platform's native style, features, and audience expectations.
Give People a Reason to Save, Share, or Comment
The highest-performing content usually delivers clear value or sparks a reaction. Educational content, tutorials, checklists, comparisons, industry insights, and actionable tips often generate strong engagement because people want to reference them later or share them with others.
Likewise, engagement increases when content invites participation. Asking thoughtful questions, sharing an opinion, encouraging discussion, or telling relatable stories gives audiences a reason to contribute rather than passively consume.
Want to put this into practice?
SideShift connects you with vetted UGC creators who actually deliver. Start your free trial and post your first job in under 10 minutes.
Test More Creative, Not Just Bigger Audiences
For brands running influencer or UGC campaigns, increasing engagement often comes down to testing more creative concepts rather than simply partnering with larger creators.
Different hooks, formats, messaging angles, and creator styles resonate with different audiences. Brands that test multiple creators and creative variations typically uncover higher-performing content faster than brands that place all of their budget behind a single partnership.
The most successful creator programs treat engagement as an optimization process. They test, learn, refine, and scale the content that earns the strongest audience response.
Track Engagement Across Every Campaign on SideShift
A strong engagement rate doesn't happen by accident. When you know exactly which creators, formats, and hooks are resonating with your audience you're able to identify and scale what works.
SideShift gives you real-time engagement benchmarks, creator comparisons, and campaign-level performance data all in one place, so you can stop guessing and start compounding.
FAQs
What is a good engagement rate on Instagram in 2026?
A good engagement rate on Instagram depends on your follower count. As a general benchmark, 0.5% is the current platform-wide average, 1.5%+ is considered strong, and anything above 3% is exceptional for most account sizes. The exception is nano and micro-influencers (roughly 1,000-10,000 followers) with highly niche audiences, who often see 4-6%+ due to smaller, tighter-knit communities.
Does engagement rate matter more than follower count?
Yes, for most brand campaigns. A creator with 10,000 highly engaged followers will consistently outperform one with 500,000 passive ones. Engagement rate signals how much an audience actually trusts and responds to a creator's content.
How do you calculate engagement rate?
The most common formula is: (likes + comments + shares) ÷ followers × 100. Some platforms and tools also factor in saves, video views, or story replies depending on the content format and campaign goal.
Why does my engagement rate drop as my follower count grows?
This is normal. As accounts scale, their follower base becomes more passive and less homogeneous. Algorithmic distribution also plays a role: not every follower sees every post, so raw engagement as a percentage of total followers naturally declines at higher tiers.
Should I use reach or followers as the denominator when calculating engagement rate?
It depends on what you're measuring. Followers-based engagement rate is better for benchmarking creators against each other. Reach-based engagement rate is better for evaluating how compelling a specific piece of content was to the people who actually saw it.